How to grow a DTC brand in a category that is still forming
In 90 days we grew the organic traffic of a US ecommerce brand in the non-nicotine pouches category by 171%, lifted Google Ads ROAS by 40.8% on a 31% smaller budget, and grew Shopify revenue 13.2% month over month. The full playbook follows.
Feb 1, 2026 to May 2, 2026. Exactly 90 days.
Day zero
A brand that worked, but was hard to find
The partner is a US-based DTC brand in the non-nicotine pouches category, selling through a Shopify storefront and select US retail networks including Walmart. On February 1, 2026 the partner gave us access to GA4, Shopify Admin, and Google Search Console. On our side, we opened a project in Ahrefs and started with its audit, so that before making any decision we could understand the brand\'s actual search visibility.
The starting position was not dramatic. The brand had product-market fit, returning customers, and steady branded revenue. On the SEO side we found 115 organic keywords, 15 of them in the top 3, an average position of 8.09, and 1,627 monthly organic visits. That is not a zero. That is a plateau.
A plateau is often more dangerous than an outright decline. A decline is visible immediately. A plateau looks like a healthy company right up to the moment a well-funded competitor enters the category and captures a meaningful share of demand. The US non-nicotine pouches category was exactly at that moment. Four large brands, each investing in awareness, each competing for the same US consumer decision: which brand to choose.
Most brands run SEO defensively, protecting branded queries. From week one we worked offensively and by day thirty we were ranking for the names of competing brands.
The bet
We did not target the brand, we targeted intent
The standard agency response in this situation is to build content around the brand itself, in the format of "5 reasons why our product." This approach does not match any actual consumer query and rarely generates organic traffic.
We chose the opposite path. The US pouches category is actively forming, and the US consumer is not searching for a specific brand because they do not yet know which ones exist. They search for reviews ("ultra pouches review", 4,500 monthly Google searches), comparisons ("nze pouches", 15,000), best-of lists ("best nicotine free pouches", 1,400), and local availability ("caffeine pouches near me", 3,300). The brand that owns these queries enters the consumer's consideration set. The brand that does not, stays out of it.
From this thesis we drew three concrete decisions. First: by day thirty of the engagement we will rank for competitor brand names. Second: we will build reach for "near me" intent in a category without a formal local SEO playbook. Third: we will rebuild the tracking stack from scratch, because all the SEO and GEO work has to translate into measurable ROAS at the end.
Trajectory
90 days in Google Search Console
Across 90 days, weekly Google clicks rose from 523 to 2,542, impressions from 15,560 to 194,088, and average position moved from 8.09 to 4.86. The first two weeks produced no visible movement. This is the reality of SEO that decks tend to skip: indexing takes time, and domain authority compounds logarithmically. The first meaningful increase came in the third week of March, when traffic crossed 1,000 weekly clicks. The week beginning April 6 closed at 2,542 clicks and 158,709 impressions. The impression peak landed in the week of April 13: 194,088. From 15,560 at the start of the window. A 12.5x multiplier.
A second source, the same trajectory
Ahrefs and Google Search Console use different crawlers and independent traffic-estimation methodologies. They report the same facts: organic traffic moved from 1.3k to 4.4k weekly, and estimated traffic value from $444 to $2,277. Independent confirmation from a second source is the standard any serious partner expects before deciding to continue the engagement.
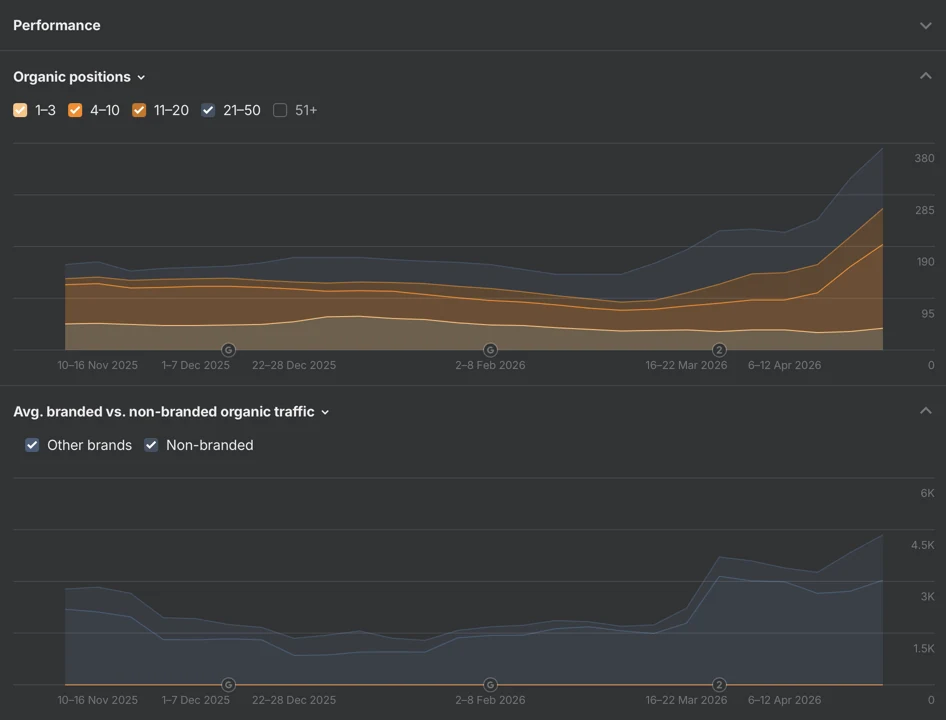
Rank distribution and branded vs non-branded traffic
A second view from Ahrefs Performance: keyword distribution across rank buckets 1-3, 4-10, 11-20 and 21-50, and average branded versus non-branded organic traffic. The spike in the final weeks aligns exactly with the engagement window and is driven by non-branded traffic, confirming the growth is not from more searches of the brand itself.
The 90-day scoreboard
Every number comes from Ahrefs Site Explorer and Google Search Console, pulled May 2, 2026, and approved for publication by the partner.
| Metric | Feb 1, 2026 | May 2, 2026 | Δ |
|---|---|---|---|
| Tracked organic keywords | 115 | 268 | +133% |
| Top-3 ranking keywords | 15 | 37 | +147% |
| Estimated monthly organic traffic | 1,627 | 4,413 | +171% |
| Estimated traffic value / month | $969 | $2,254 | +133% |
| Avg Google position (GSC, weekly)lower number = higher in results | 8.09 | 4.86peak Apr 6 | ↑ 3.2 spots higher |
| Weekly clicks (GSC) | 523 | 2,542peak Apr 6 | +386% |
| Weekly impressions (GSC) | 15,560 | 194,088peak Apr 13 | +1147% |
The 90-day playbook in three stages
We split the playbook into three stages: mapping the competitor gap (February), scaling content production and fixing the technical foundation (March), and the GEO layer plus a server-side tracking rebuild (April). Each stage is four to six weeks of team work, with a clearly scoped deliverable and a measurable outcome.
Mapping the competitor gap
The first four weeks were dedicated to analytical work in Ahrefs and Google. Rather than producing content, we were mapping the existing search landscape. We prepared 31 topical pillars, each built on a fan-out query cluster: X review, X vs Y, best X for Z, X near me, is X safe, X ingredients. Each cluster was bound to a specific landing page and a specific stage of the buyer journey. Only with this map in place did we begin producing content. That sequence is critical. Most brands write first and map later, and do not understand why the content fails to rank.
- 246 articles published across nine phases
- 31 topical pillars bound to stages of the buyer journey
- Titles match the literal fan-out query, H2s mirror related sub-questions
Scaling content production and fixing the technical foundation
March ran on two parallel tracks. First, content production reached full scale based on the map prepared in February. Second, we identified a serious technical bug that had been suppressing product page rankings for months. Every product page was serving its full body of roughly 3,000 characters as the meta description, because the GraphQL fragment did not include the seo { title description } field. We fixed it in a single pass across all 59 SKUs through the Shopify Admin API. Titles were capped at 50 characters, descriptions normalized to 130 to 155 characters, with a hook up front and a sensory accent. This is the least visible part of SEO work, and the part that pays back fastest.
- Meta description bug resolved across 59 SKUs in a single pass
- Article, BreadcrumbList, FAQPage and Product schema on every page
- Heading sanitization (H1 to H2) on Shopify rich-text bodies
GEO layer and tracking rebuild
April delivered the two least visible but strategically most important changes of the engagement. First, we onboarded the brand into the discovery layer for language models: llms.txt and llms-full.txt files, Link headers on the homepage, the Content-Signal: search=yes, ai-input=yes, ai-train=yes directive in robots.txt (most brands accidentally opt out of AI training), /.well-known/api-catalog (RFC 9727), and /.well-known/agent-skills/index.json. Second, we rebuilt the entire server-side tracking stack. Cloudflare Zaraz in the browser, a dedicated SGTM Worker at the edge, a dual-path firing pattern with a shared event_id, a Shopify orders/paid webhook connecting to five ad platforms at once. None of these changes are visible in an ads dashboard, but every one of them is visible to the Meta and Google optimizers. The result: Google Ads ROAS up 40.8% with no creative changes.
- Meta catalog match: from 54% to over 90%
- Google Ads ROAS: from 1.36x to 1.91x (+40.8%)
- CPA: from $39.06 to $28.57 (-26.9%)
We rewrote the tracking, not the creative. Google Ads ROAS rose 40.8% on a 31% smaller budget because the platform optimizer received cleaner signal, not a new ad.
The keywords that paid
A selection from 268 keywords ranking in Google. The "Feb 1" and "May 2" columns show the page's position in Google search results at the start and end of the engagement window (#1 is the top result).
| Keyword | Searches / mo | Rank Feb 1 | Rank May 2 | Δ rank | Landing page |
|---|---|---|---|---|---|
| best nootropic pouches | 1,300 | #35 | #1 | +34 | /blog/best-nootropic-pouches-buyers-guide |
| nicotine alternative pouches | 450 | #55 | #5 | +50 | /blog/best-nicotine-pouch-alternatives |
| ultra pouches | 35,000 | #70 | #22 | +48 | /blog/competitor-review-A |
| best nicotine free pouches | 1,400 | #48 | #5 | +43 | /blog/best-nicotine-free-pouches |
| caffeine pouches near me | 3,300 | #43 | #5 | +38 | /blog/caffeine-pouches-near-me |
| nze pouches | 15,000 | #28 | #8 | +20 | /blog/competitor-review-B |
| urine cotinine levels after 7 days | 500 | #12 | #1 | +11 | /blog/cotinine-levels-after-quitting-nicotine |
| ultra pouches near me | 5,600 | NEW | #1 | – | /partners/walmart |
| nootropic pouches near me | 700 | NEW | #2 | – | /blog/where-to-buy-nootropic-pouches |
| zyn ingredients list | 500 | NEW | #9 | – | /blog/zyn-ingredients-explained |
| black buffalo zero | 2,600 | NEW | #10 | – | /blog/competitor-review-C |
| caffeine half life calculator | 1,100 | NEW | #10 | – | /blog/caffeine-half-life-calculator |
| how old to buy caffeine pouches | 350 | NEW | #1 | – | /blog/how-old-to-buy-caffeine-pouches |
The pages driving the most traffic
A small set of articles is responsible for the majority of the brand's organic traffic. Each one targets a specific buyer query previously owned by a competitor.
AI visibility
Brand citations across AI search engines
The GEO work translated into direct brand citations inside language-model responses and Google AI Overview panels. The data is pulled from Ahrefs Brand Radar, snapshot May 2, 2026. The values shown in green are the increase in citations and citing pages compared to the pre-engagement baseline.
The technical play
Why ROAS rose 40.8% without changing a single creative
The most common mistake in DTC measurement infrastructure is that Meta and Google ads run on browser-only signal. Safari ITP zeroes the _fbp and _fbc cookies every seven days, and users on Brave, uBlock, or iOS17 are effectively invisible to the platform optimizer. For this partner, the Meta catalog match sat at just 54%, meaning roughly half of all Add-to-Cart events reached Meta without product context and could not be used for retargeting or fed into Advantage+ campaigns.
On the browser side we deployed Cloudflare Zaraz in consent-aware mode for GA4 and Google Ads. On the server side we launched a dedicated SGTM Worker on a partner-owned subdomain on Cloudflare edge infrastructure, handling Meta CAPI, TikTok Events API, Snap CAPI, and GA4 Measurement Protocol. Every event fired from the browser has a server-side counterpart with the same event_id, so the platforms dedupe to a single event while receiving two sources of signal, which translates into higher match quality.
A Shopify orders/paid webhook hits the same Worker and distributes the Purchase event to five platforms at once. This closed a gap most DTC brands never notice: Shopify checkout lives on a different domain from the storefront, so the browser-side Purchase pixel often does not fire. Server-side signal ensures completeness. We also standardized phone and email normalization between Add-to-Cart and Purchase events (lowercase, trim, remove non-digit characters), without which Meta’s Event Match Quality could not stitch the same user across both events.
The result: Meta catalog match rose from 54% to over 90%, Google Ads ROAS moved from 1.36x to 1.91x on a 31% smaller budget, and CPA dropped from $39.06 to $28.57. This outcome is not achieved by changing creatives. It is achieved by feeding cleaner signal into the platform’s learning model.
Lower budget, higher return
A March to April comparison: spend down 30.7%, ROAS up 40.8%, CPA down 26.9%, conversions down only 5.3% on a 31% smaller budget. This combination of indicators is only possible when the quality of the signal reaching the ad platform optimizer rises significantly.
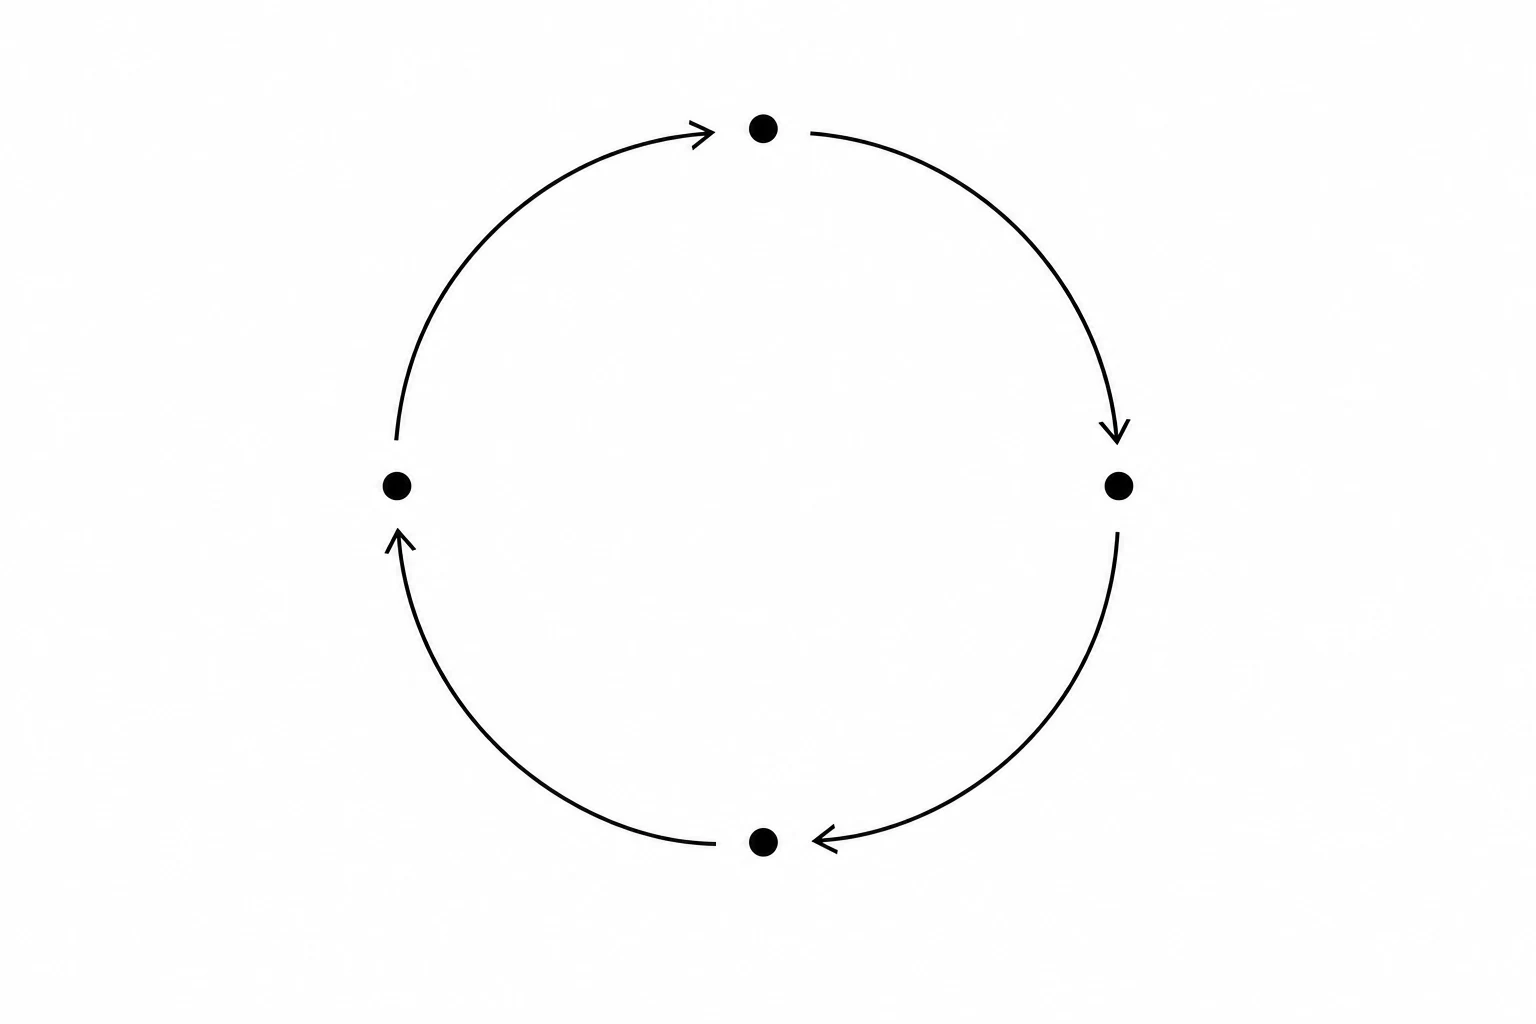
The flywheel
Four levers in a closed loop. Each one feeds the next, and every successive iteration costs less than the one before it.
GEO is SEO with a different audience. You stop optimizing for the crawler and start optimizing for the language model that is about to quote your content in a response to a consumer.
Commerce
What happens when organic traffic meets a working checkout
A month-over-month comparison of Shopify data for April versus March shows a clear pattern. Growth is driven almost entirely by new-customer activity: their count rose 18.5% and the revenue they generated rose 24.1%. Returning-customer revenue grew by only 2.5%. This is the characteristic shape of a working SEO and GEO combination: organic traffic introduces a new consumer to the brand, ads close the purchase, the store delivers the conversion. Returning customers stay on their existing purchase cycle.
Per partner preference, percentages only, no dollar values.
What is next
The next six months
Below is a summary of the plan we presented to the partner in the May 1, 2026 follow-up.
Verify our numbers
Full transparency within the NDA
The partner brand, a US-based DTC company, is not named in this case study due to an active non-disclosure agreement. Every number and every screenshot has, however, been reviewed and approved by the partner before publication. If you are evaluating an engagement with LuKas Holdings, we sign a mutual NDA and disclose the brand name. The organic data in Ahrefs and Google Search Console is publicly verifiable by anyone who knows the domain, so every search-visibility number in this document can be checked independently. Shopify sales data remains confidential and is not shared with third parties.
The questions we get most often
How long does SEO take to show results for a Shopify store?+
During this engagement the first two weeks produced no visible movement. The first meaningful uplift, crossing 1,000 weekly clicks, came in the third week of March, around six weeks after the start. The full scale of growth, a 2x to 5x multiplier, materialized between weeks eight and twelve.
What is the difference between SEO and GEO?+
SEO covers optimization for search engine crawlers, such as Googlebot or Bingbot. GEO (Generative Engine Optimization) covers optimization for language models that cite content in their generated answers, including ChatGPT, Perplexity, Claude, Gemini, and Google AI Overviews. In practice SEO rewards H1 and H2 heading structure, internal linking, and structured data. GEO rewards 40 to 60 word extractable passages under every H2, the literal query as the page title, FAQPage structured data with literal questions, and llms.txt files.
How can a brand rank for "near me" queries in the US without a Google Business Profile?+
It takes three components. The first is a hub article in the format where to buy X that Google treats as a category-wide answer. The second is a set of programmatic /partners/[retailer] pages hydrated from a database of US retailer locations (Walmart, Target). The third is Place and LocalBusiness structured data on every retail-partner page. Within this engagement, that combination delivered the #1 position for ultra pouches near me (5,600 monthly US searches) without using Google Business Profile.
Is server-side tracking necessary if GA4 is already in place?+
GA4 is responsible for reporting. Ad campaign optimization is a separate concern. Meta and Google train their bidding models on the signal received through Conversions API and Measurement Protocol. Without a server-side layer, Safari ITP zeroes the _fbp and _fbc cookies every seven days, content blockers lose 30% to 50% of events, and Shopify checkout in many configurations does not fire the browser pixel. A server-side tracking layer removes all three limitations. In this engagement the result was a shift in Google Ads ROAS from 1.36x to 1.91x without any creative changes.
Does this playbook apply outside the pouch category?+
Yes, provided three conditions are met. The first is a category in a growth phase rather than a saturated one, in which new fan-out queries appear each month. The second is a DTC stack built on Shopify or a headless architecture, which can host a server-side tracking layer. The third is a product with market fit, because SEO accelerates existing demand and does not create it from scratch. In saturated categories we shift the mix: less content addressing competitor gaps, more retention work and more defensive communication for branded queries.